Our Methodology: How Seasonal Signals Works
Discover the science and data analysis behind our seasonal pattern identification system.
What Are Seasonal Patterns?
Seasonal patterns in cryptocurrency markets are recurring price tendencies that happen during specific times of the year, month, or even week. These patterns can emerge due to various factors:
- Project-specific events like network upgrades, token unlocks, or conference dates
- Market cycles that tend to repeat due to trader psychology and behavior
- Institutional flows like quarterly rebalancing or fiscal year considerations
- Calendar effects that influence market sentiment and liquidity

Our Data Analysis Process
Seasonal Signals uses a rigorous, multi-step process to identify potential seasonal edges in cryptocurrency markets.
1. Data Collection
We gather years of historical price data from reputable exchanges for each cryptocurrency.
2. Pattern Analysis
Our algorithms analyze the data to identify recurring price movements during specific calendar periods.
3. Statistical Testing
We apply statistical methods to validate patterns and filter out random noise.
4. Edge Identification
Patterns that meet our criteria become "edges" with specific entry/exit dates and historical metrics.
Key Metrics We Track
For each identified seasonal edge, we calculate and display several important metrics:
- Win Rate: The percentage of times the pattern resulted in a positive outcome historically
- Average PnL: The mean percentage gain/loss across all historical occurrences
- Duration: The typical length of the pattern from entry to exit
- Consistency: How reliably the pattern has appeared over the years
- Year-by-Year Results: Individual performance for each historical occurrence
Types of Seasonal Patterns We Identify
Our system identifies several categories of seasonal patterns in cryptocurrency markets.
Calendar-Based Patterns
Recurring tendencies tied to specific dates, months, or quarters (e.g., "September Effect").
Event-Driven Patterns
Price movements associated with recurring events like network upgrades or token unlocks.
Volatility Patterns
Periods where price volatility tends to increase or decrease predictably.
Correlation Patterns
Seasonal relationships between different cryptocurrencies or market sectors.
Support/Resistance Patterns
Seasonal tendencies for price to find support or resistance at specific times.
Momentum Patterns
Periods where price tends to accelerate in a particular direction.
How to Use Seasonal Signals
Our app is designed to complement your existing trading strategy, not replace it.
Best Practices
- Use as a Supplementary Tool: Combine seasonal insights with your technical or fundamental analysis
- Focus on Higher Win Rates: Prioritize patterns with stronger historical performance
- Consider Market Context: Be aware of the current market environment and how it might affect seasonal patterns
- Always Use Risk Management: Set appropriate stop losses and position sizes regardless of seasonal edge strength
Important Disclaimers
Understanding the limitations of seasonal analysis is crucial for responsible use.
Past Performance: Historical patterns are not guarantees of future results. Market conditions change, and patterns can break down.
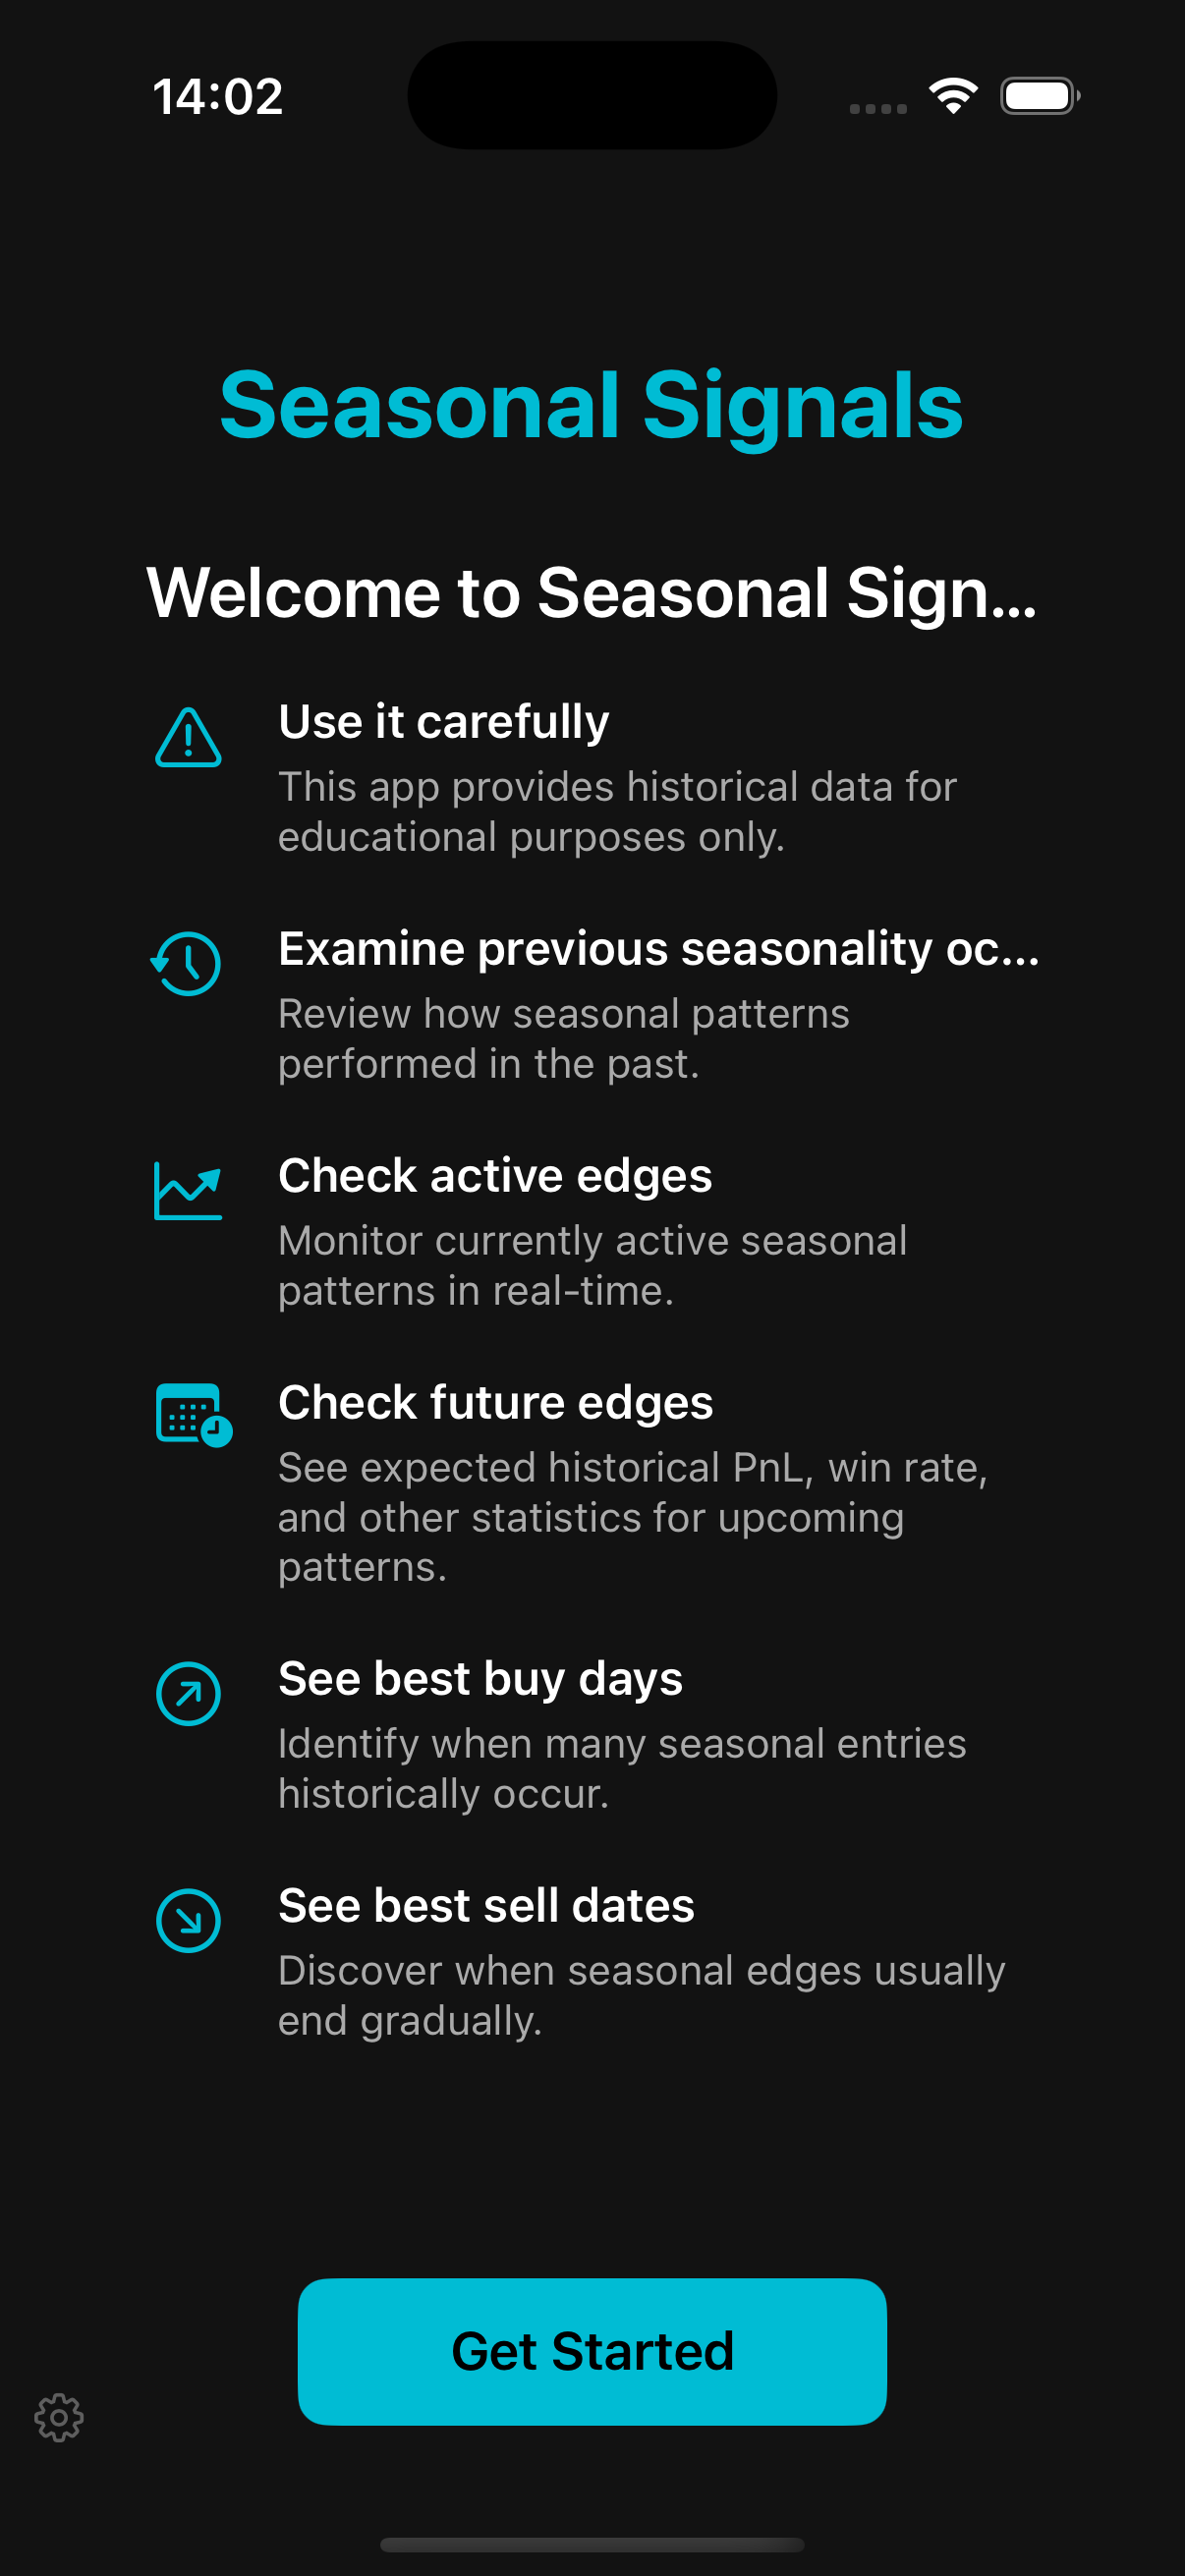
Educational Tool: Seasonal Signals is designed for educational purposes only. It is not financial advice.
Risk Awareness: Cryptocurrency trading involves substantial risk. Never invest more than you can afford to lose.
Complementary Approach: Seasonal analysis should be one of many tools in your trading toolkit, not the sole basis for decisions.