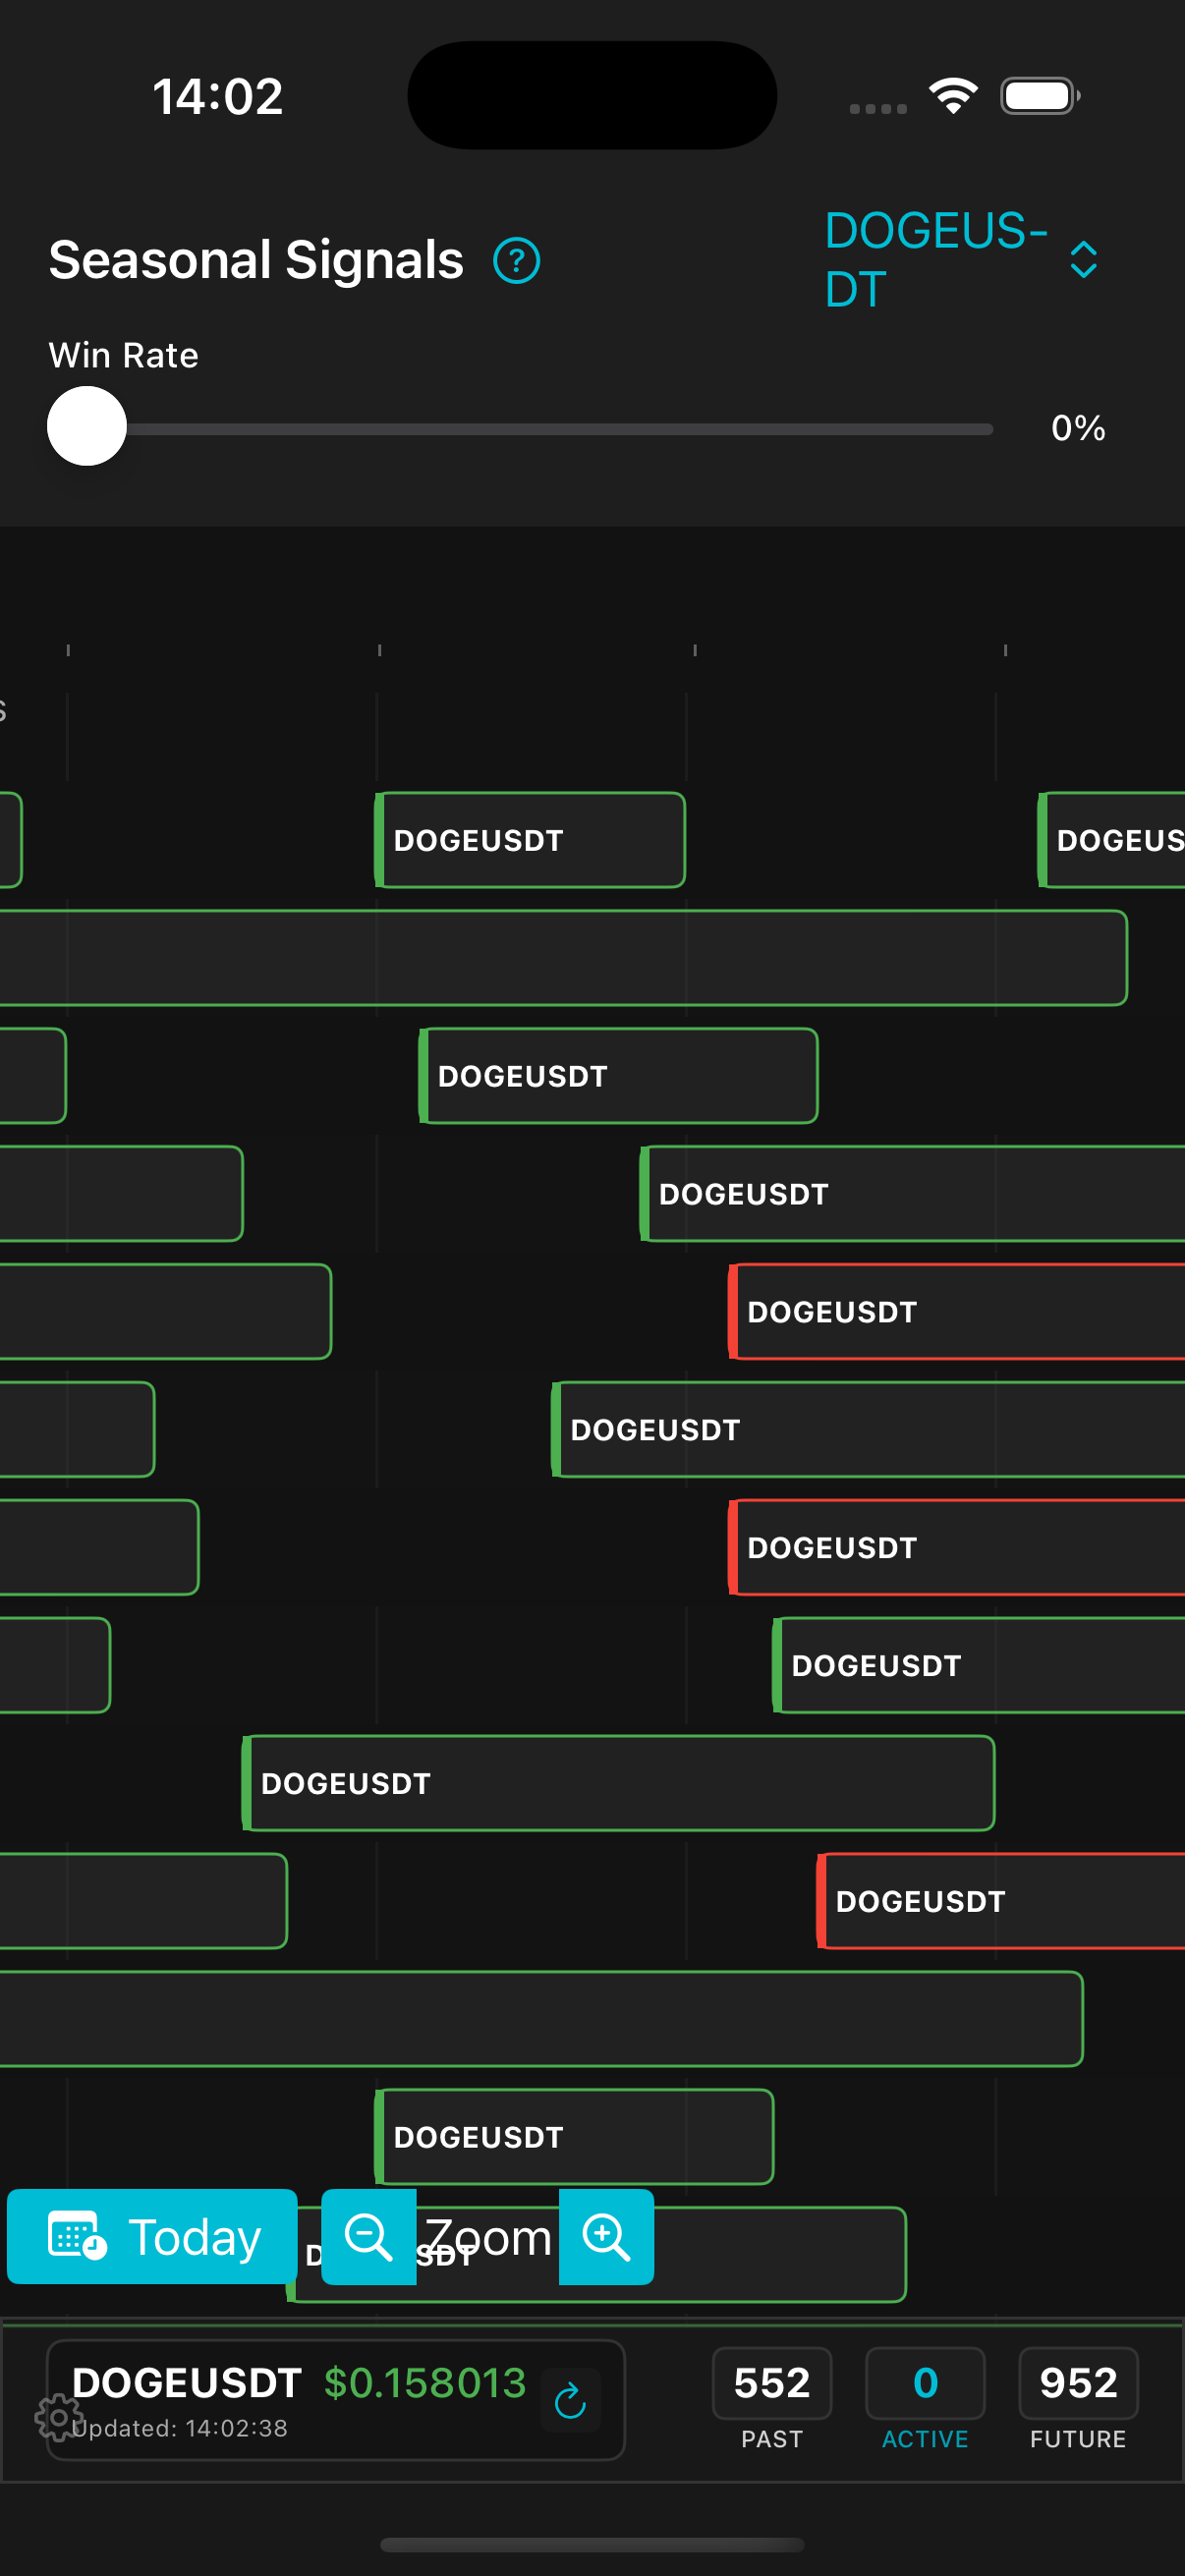
Cardano (ADAUSDT) Seasonality Analysis
Discover historical patterns and seasonal edges for Cardano trading against USDT.
About Cardano
Cardano (ADA) is a proof-of-stake blockchain platform founded on peer-reviewed research and developed through evidence-based methods. It aims to provide a more balanced and sustainable ecosystem for cryptocurrencies with a focus on security, scalability, and interoperability.

Does ADAUSDT Have Seasonal Tendencies?
Like many assets, ADAUSDT's price action can exhibit seasonal patterns. Factors like network upgrades, staking cycles, broader market sentiment shifts, or even project-specific news timelines can contribute to recurring tendencies. Seasonal Signals helps you visualize and quantify these potential historical patterns for ADAUSDT.
Historical Insight Example
Our historical analysis reveals a tendency for ADAUSDT to find support in early Q2. For instance, a pattern starting around March 20th and concluding near May 10th has shown a positive win rate of 65% over the past 6 years, with notable strength in years with major network updates during that period.

Win Rate
65%
Avg. Gain
12.7%
Duration
~50 days
Occurrences
6 years
Important Considerations
The seasonal analysis for ADAUSDT is based on historical data and provided for educational purposes only. It is not financial advice. Trading ADAUSDT carries significant risk. Past performance does not guarantee future results. Always do your own research and manage risk.